Monitoring With Prometheus (Part-I)
Jun 28 2020When it comes to managing distributed microservices, Monitoring could be one of the main obstacles. Monitoring microservices based architecture has never been easy and especially when combined with orchestration tools like Kubernetes. Out of the long list of open source time-series databases available, Prometheus is one of the most widely popular. Prometheus has even emerged as a de-facto monitoring solution with Kubernetes. Let’s discuss in detail about what Prometheus, how it works and how we can use it in our stack.
Prometheus is an open source metric based monitoring system which has a simple yet powerful data model. Along with it comes a query language PromQL, that helps in observing how our applications are behaving and performing. It involves analysing the metrics data with the help of labels(key, value pairs). And, PromQL allows aggregation labels so that we can analyse not only per process but also per datacenter and per service. Labels is an interesting concept, which we’ll discuss later. Prometheus is written in Go and have instrumentation available in languages like Python, Go, Java, Haskell, JavaScript etc.
Let’s throw some more light on Monitoring and it’s various aspects. If I were to disintegrate monitoring, it would be basically into four major things: Alerting, Debugging, Trending and Installing. And to explain more,
Alerting: When to know if things go wrong or out of hand
Debugging: Investigating the root cause for the same
Trending: An ability to see how our systems are being used and changing over the time
Installing: At times utilising your monitoring solution for other purposes rather than just building a particular solution.
And Prometheus essentially covers all the above mentioned aspects of monitoring by providing out-of-the-box solutions for alerting, debugging, analysing the changes over the time through dashboarding solutions with tools like Grafana etc. So what are these metrics which Prometheus collects? In simple words, Metric is any particular piece of data that you wish to track over the time. For example, Number of times you received HTTP requests, how much time was spent in handling requests and how many requests are currently in progress. Now the essential use cases of monitoring metrics are like using metrics to track the latency and data volumes handled by each of the systems in your application to determine what exactly is causing a slowdown. On the other hand, logs could not record that much information or fields.
Now the big question comes to our mind is, how does Prometheus even works? Prometheus discovers targets to scrape metrics by using service discovery. These can either be our applications or third party applications and we can even use an exporter to scrape metrics from these apps. The scraped data is stored into some backend storage and we then use PromQL queries to fetch the desired results. We can even create alerts using another Prometheus integration called alertmanager, which helps in configuring pages, emails, and other notification based alerts. Since we mentioned exporter, it is a piece of software that is deployed right beside the application we want to collect metrics from. It takes request from Prometheus, collects the required data in correct format from the application, transforms the data into a Prometheus readable format and returns the response to Prometheus.
Let’s discuss, how to get started with Prometheus. We can download the required binaries of Prometheus server and alertmanager from this official link. So once we download the required tar, we get the below set of files upon unpacking it:
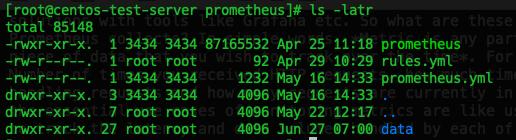
And the main file to look at is the prometheus.yml config file in which a basic scrape config could like below:
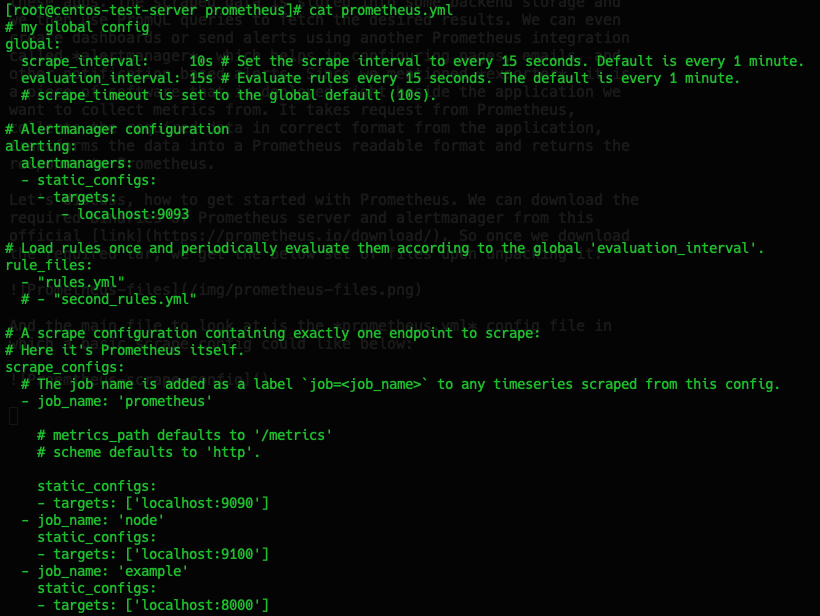
Now my config definition houses more than one targets, but main thing to look for is scrape_configs. And this is what defines how Prometheus will be scraping metrics from those mentioned targets (ex: localhost:8000) or any service running on the specified address. Also, we can see in the above config file definition of alerts specifying once alertmanager is installed and running. In general, the prometheus dashboard looks like below with or without passing a search for particular metrics:
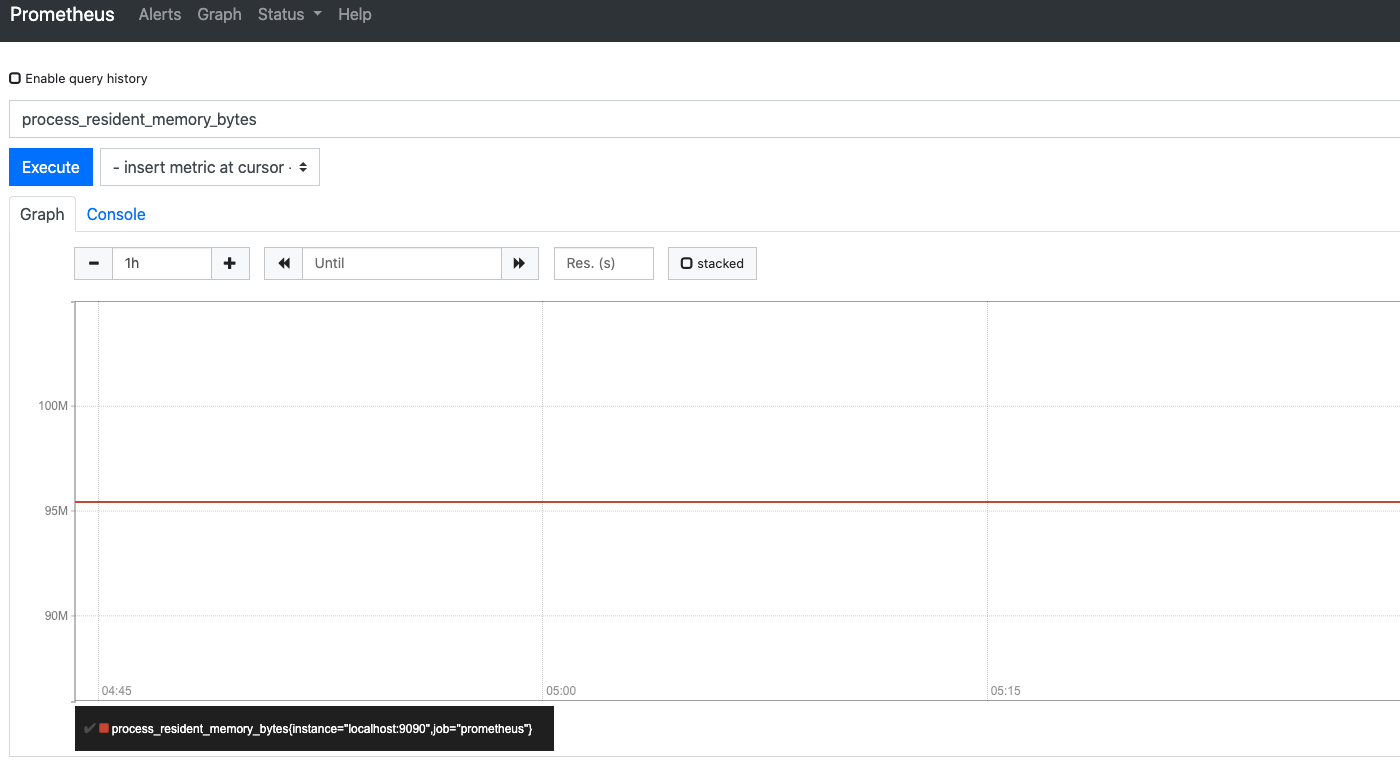
We can use PromQL to query the database for any respective metrices. Also, there are two ways to represent it: normal console view and another is a Graph view. Although, Prometheus UI doesn’t give much detailed and shaped representation but integrating the same with a proper dashboarding tool like Grafana can do wonders. The convention in Prometheus for any metric is to use base units such as bytes and seconds and leave pretty printing to tools like Grafana. And the strong reason behind this, as an internal RPC may take microseconds while polling a long running process might take hours or even days.
So in this first part, we have seen: what is Monitoring, What Prometheus is and how it works. In the next part I’ll take through some deep diving across Prometheus ocean and also will show how to integrate it with some applications. Until next time!!